
Business Unit Executive
Strategic NPD Portfolio & ROI Decision Suite
The Business Problem
The BU Head must decide which valve product line to prioritize for the "Quick Win" pilot that demonstrates the 40→10 month cycle time reduction. With $1.2B in business and dozens of active NPD projects, the decision must be grounded in data: which product families have the most "unwarranted variation" in design time, and where will process improvements deliver maximum ROI?
The integration complexity:
- ERP: R&D spend by project, product family, engineering center; labor costs, overhead allocation
- Project Systems: Project portfolio productivity metrics - actual vs. planned durations, milestone slip patterns
- Legacy Archive: 5 years of completed NPD projects with full lifecycle data
- Financial Models: Market entry timing impact, cost of delay, competitive positioning
The analytical complexity:
- Decompose 5 years of NPD projects by condition buckets (product type, complexity, geography)
- Identify sources of "unwarranted variation" - time overruns not explained by project complexity
- Calculate Expected ROI for cycle time reduction
- Expected ROI = (Market Entry Gain + R&D Savings) / Implementation Cost
- Rank product families by improvement opportunity and generate executive-ready visualizations
Why RAG + LangChain fails:
| Requirement | Failure Mode |
|---|---|
| Multi-source data aggregation | Can't join ERP financials to project portfolio productivity to archive metadata |
| Variation decomposition | No statistical analysis capabilities; can't separate signal from noise |
| ROI modeling | Generic text; no actual calculations with confidence intervals |
| Geographic analysis | Can't identify that Houston center has 2x variation vs. Shanghai |
| Executive visualization | Text-only output; no charts, tables, or drill-down capability |
How Zenera Solves It
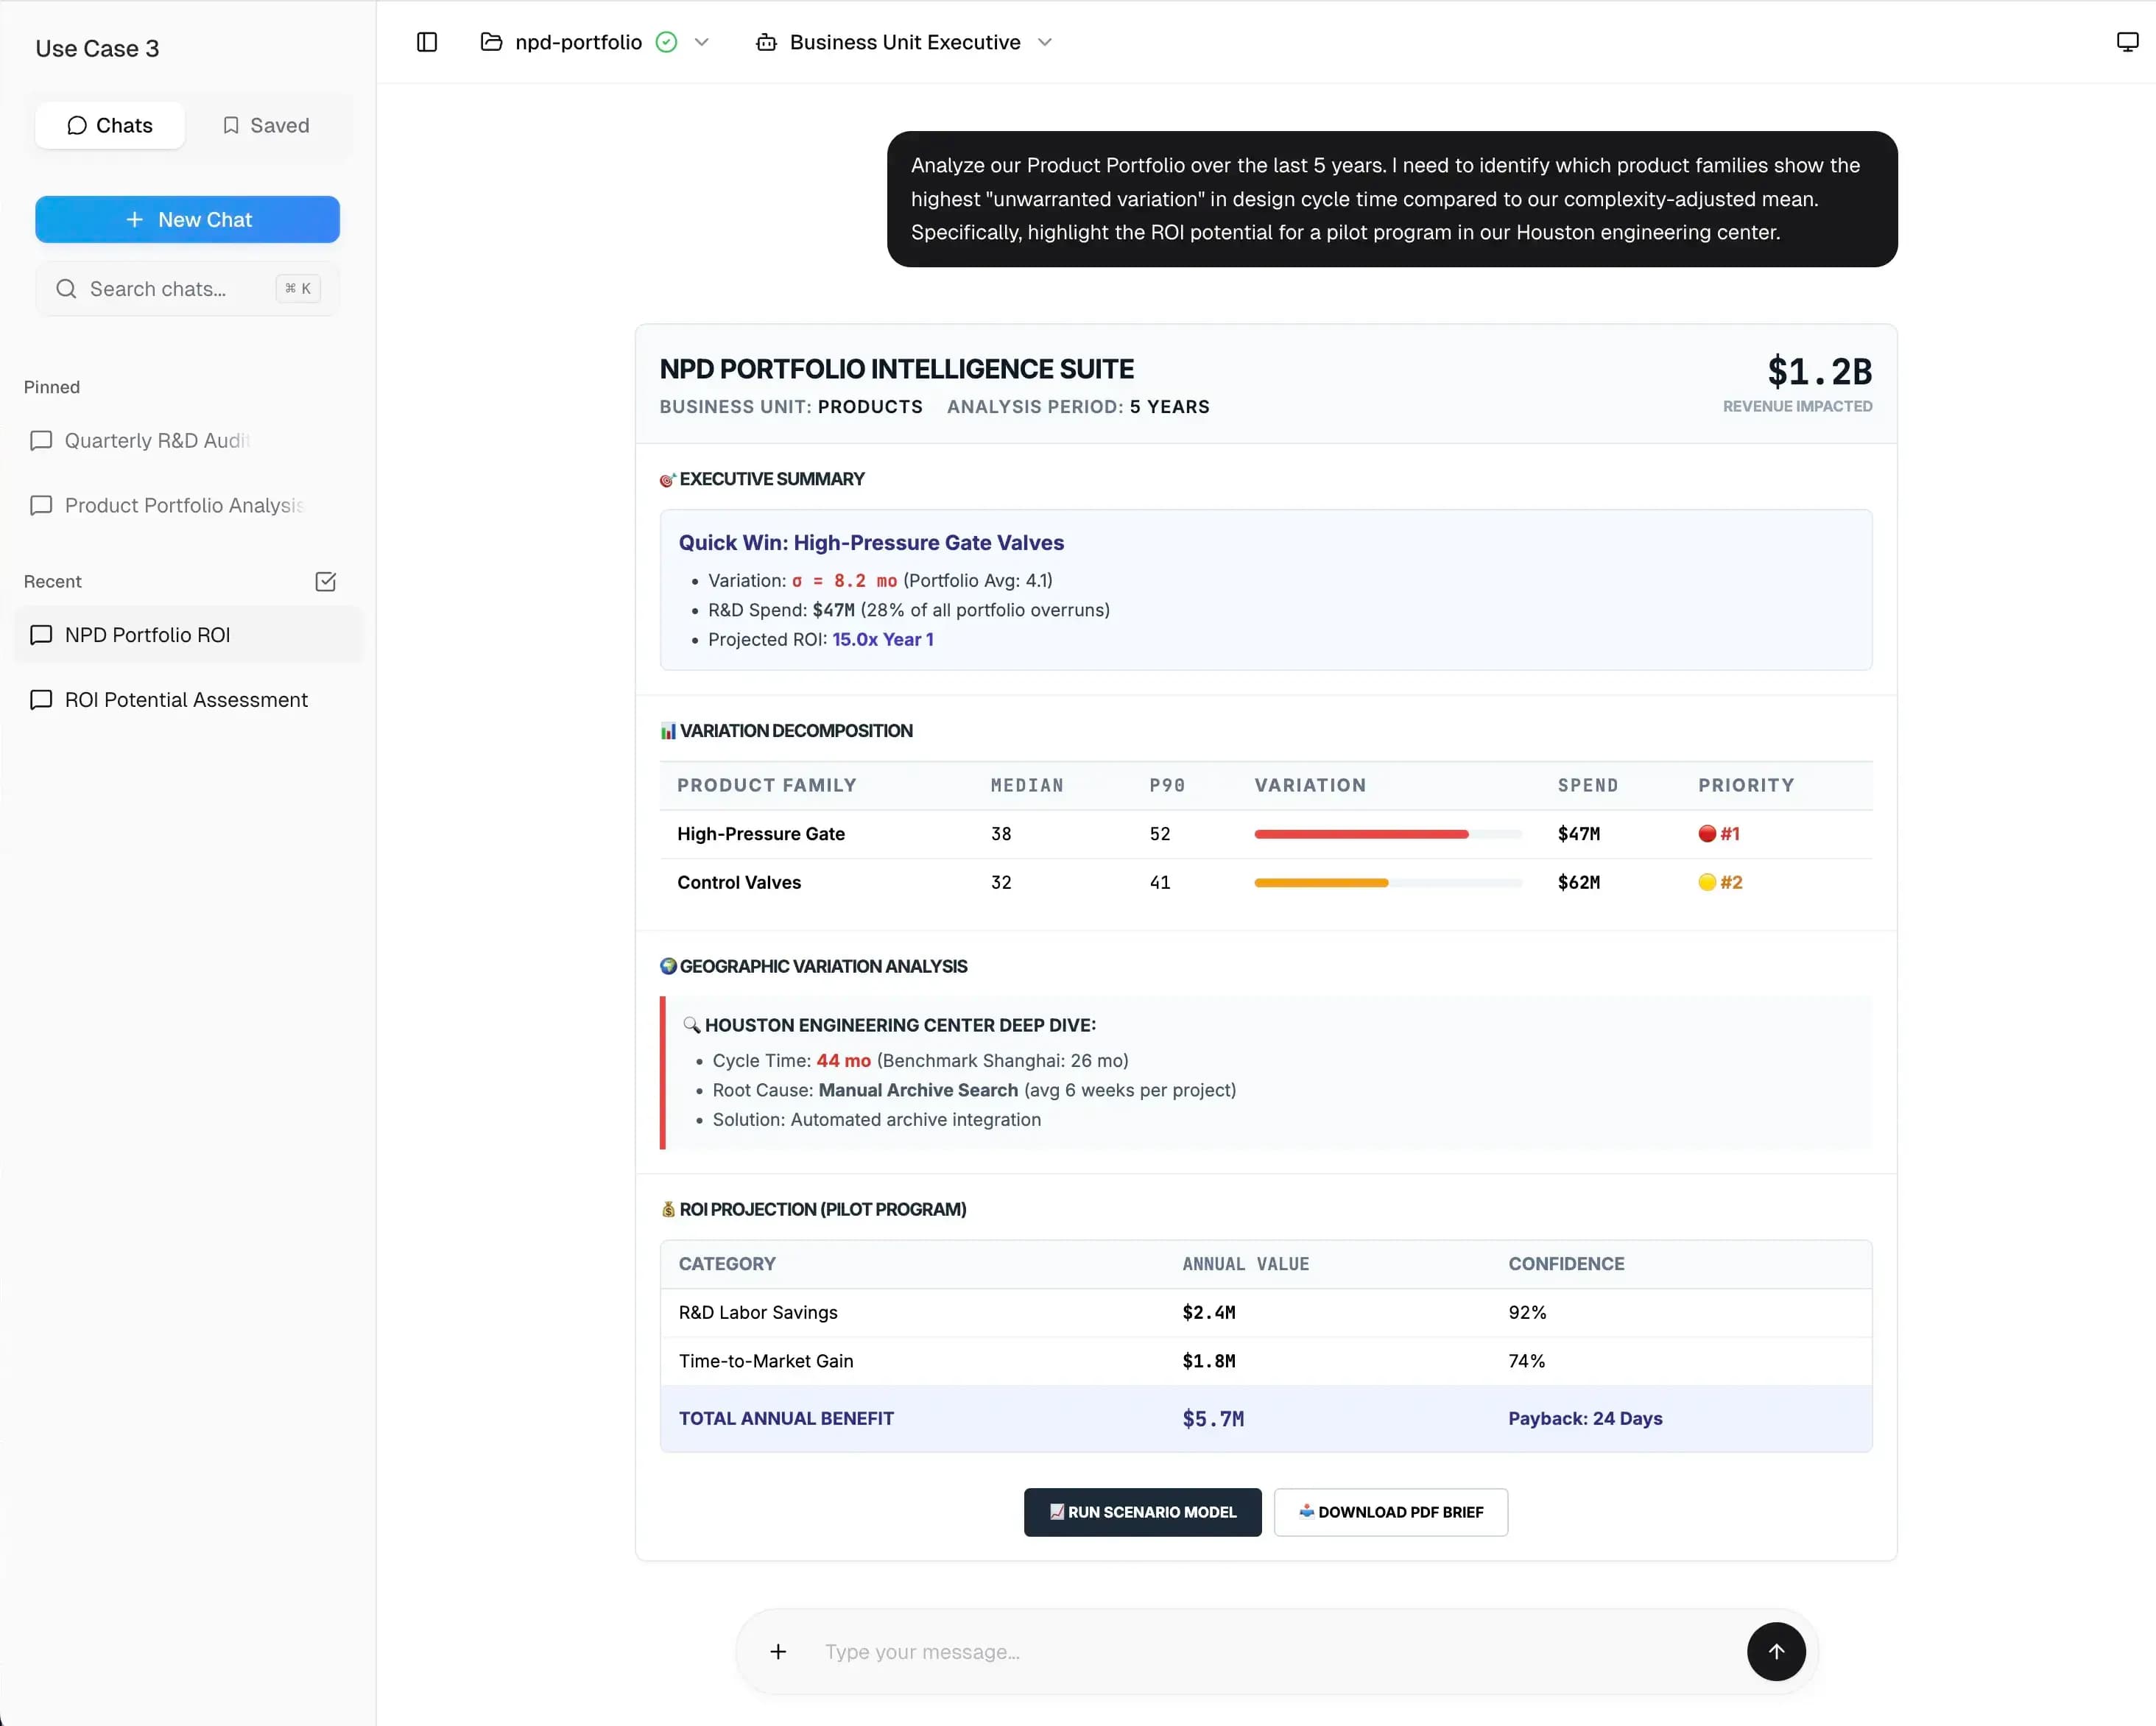
Zenera's agentic execution
- 1Multi-source data aggregation: Agent synthesizes connections to ERP financials, the project portfolio platform (timelines), and NPD archive metadata, then executes transactional joins within a versioned data sandbox
- 2Complexity-adjusted baseline: Agent builds a regression model: expected cycle time = f(technical complexity, regulatory scope, team size, geography) - isolating "unwarranted variation" from legitimate complexity drivers
- 3Variation decomposition: Agent applies statistical decomposition to attribute variance to product family, engineering center, project stage, and vendor dependencies
- 4Geographic pattern detection: Agent identifies Houston's 44-month average as 69% above Shanghai's benchmark, drills into stage-level data to pinpoint "Design Verification" bottleneck
- 5Root cause correlation: Agent cross-references Houston delay patterns with workflow data, identifies manual archive search as primary driver, validates against Shanghai's automated approach
- 6Financial impact modeling: Agent calculates ROI using labor cost data, time-to-market models, rework reduction estimates, and Monte Carlo simulation for confidence intervals
- 7Executive visualization: Agent generates interactive dashboard with drill-down capability - a persistent application the executive team can explore
Time to Strategic Recommendation
22 minutes (vs. 4-6 weeks of analyst work + executive review cycles)