
Financial Analyst
Predictive TCOR Benchmarking & Deductible Optimization
The Business Problem
A Financial Analyst must determine whether adjusting deductibles for a specific property line will lower the Total Cost of Risk (TCOR) over a 36-month horizon. This requires correlating internal claims data with external market multipliers, analyzing decades of policy history, and running constraint-based simulations - all while producing executive-ready recommendations.
The integration complexity:
- Risk Management Platform Data: Real-time extraction of 11 risk parameters and 5+ years of historical claims data
- External Market Data: Industry risk multipliers and peer benchmarking data via carrier APIs and market data feeds
- Policy Archives: Decades of Policy Schedule PDFs requiring visual extraction of limits, premiums, and coverage evolution
- ERP Integration: Safety investment costs, capital allocation constraints, and operational budgets
The analytical complexity:
- Synthesize 5 years of loss data from transactional systems with unstructured policy archives
- Visually extract coverage limits, deductibles, and premium trends from scanned policy schedules
- Identify "over-insured" areas by correlating actual loss experience with coverage purchased
- Run constraint-based simulations: deductible changes vs. premium savings vs. self-insured retention risk
- Model alternative capital allocations: premium savings redirected to loss prevention investments
- Produce executive-ready dashboards with defensible strategic recommendations
Why RAG + LangChain fails:
| Requirement | Failure Mode |
|---|---|
| Policy schedule extraction | Completely blind - cannot parse tables and coverage structures from PDFs |
| Multi-year trend analysis | Context overflow; can't hold 5 years of claims + policy history |
| Constraint-based modeling | No simulation capabilities; produces generic text only |
| External API integration | No carrier data connectors; would require months of custom development |
| Executive visualization | Text output only; cannot generate dashboards or charts |
| TCOR calculation | Generic math; doesn't understand insurance-specific cost components |
How Zenera Solves It
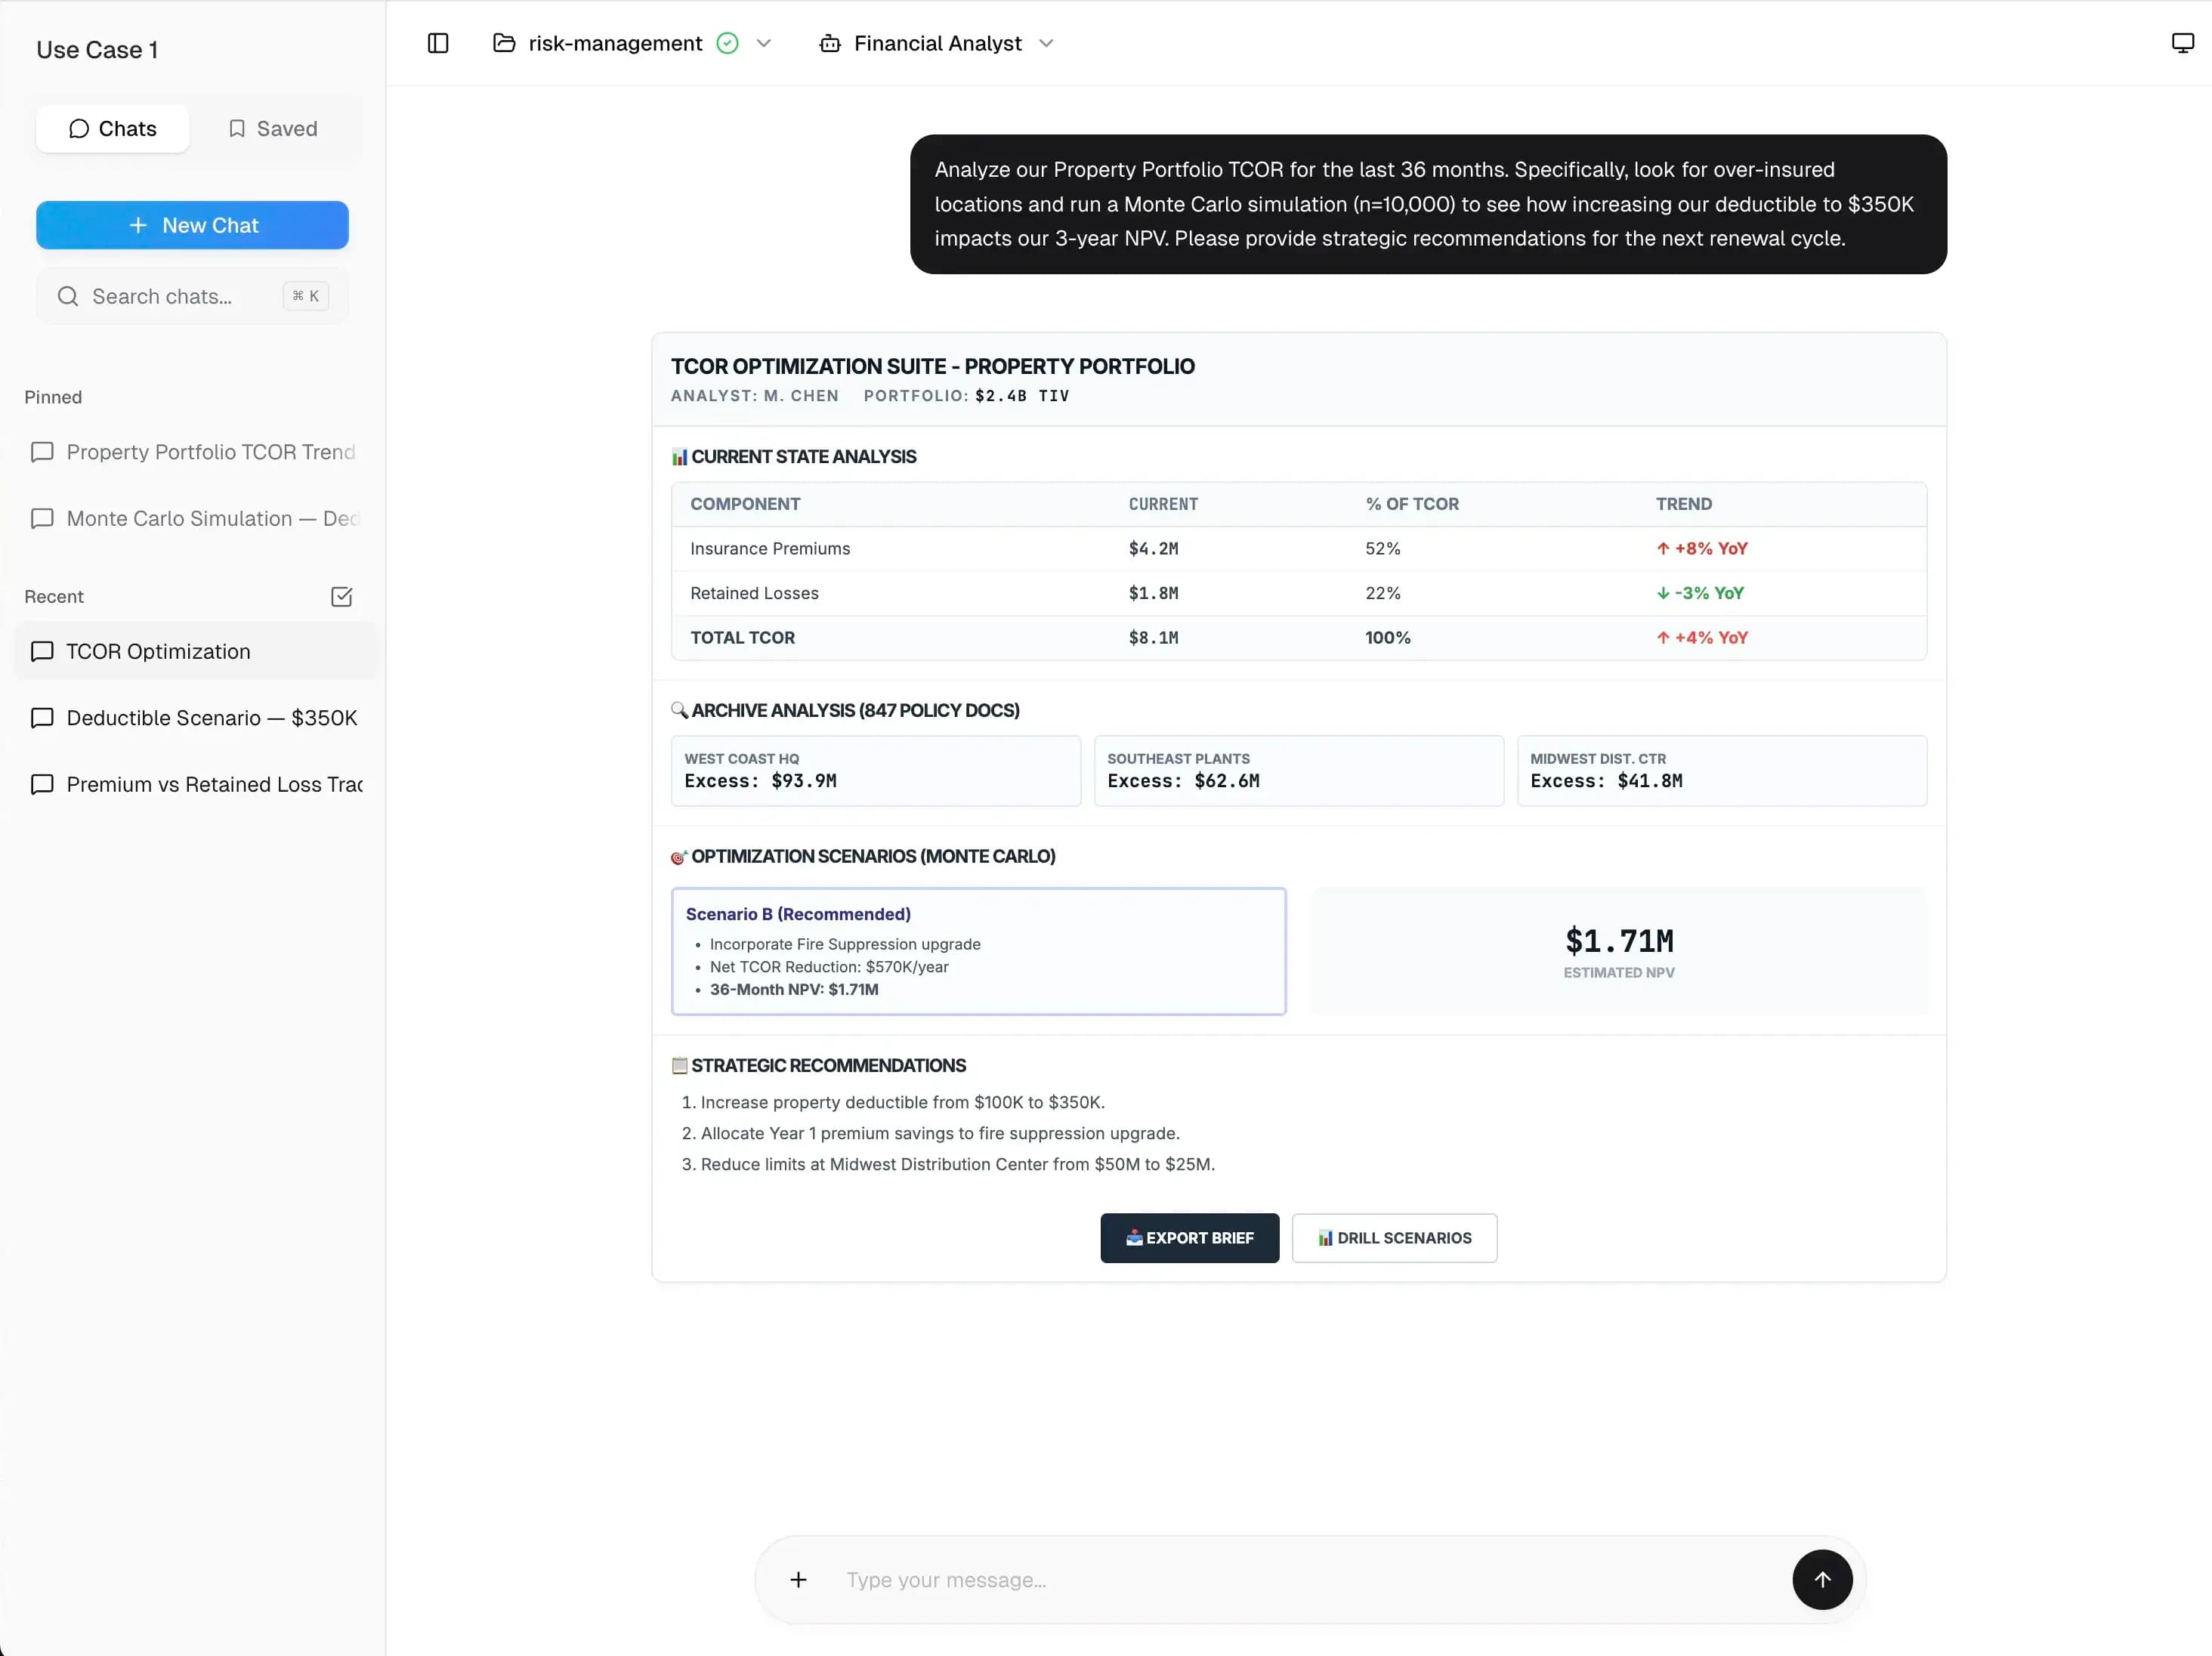
Zenera's agentic execution
- 1Visual policy archive ingestion: Agent processes 847 policy schedule PDFs spanning 26 years, extracts limits, deductibles, premiums, and endorsement structures using vision models
- 2Self-coding risk platform integration: Agent analyzes risk platform API documentation, synthesizes connector for real-time extraction of 11 risk parameters and historical claims
- 3External market data synthesis: Agent connects to carrier APIs and market data feeds, ingests industry risk multipliers and peer benchmarking data
- 4Over-insurance detection: Agent correlates maximum historical loss per location with current coverage limits, identifies systematic over-insurance patterns
- 5Constraint-based modeling: Agent builds simulation model incorporating:
- Premium-to-deductible elasticity curves from market data
- Historical loss frequency and severity distributions
- Capital allocation constraints from ERP
- Loss prevention ROI estimates from peer studies
- 6Monte Carlo simulation: Agent runs 10,000 scenario iterations, produces probability distributions for each optimization path with confidence intervals
- 7Executive visualization generation: Agent synthesizes interactive dashboard with charts, tables, and drill-down capability - not static text output
- 8Reasoning graph construction: Every recommendation traces to specific policy clauses, claims data, market benchmarks, and simulation parameters
Time to Strategic Recommendation
18 minutes (vs. 3-4 weeks analyst work + actuarial review)