
Closing the Gap - Episode 2 of 8
How to put a number on the 6:10 problem that your CFO will actually accept.
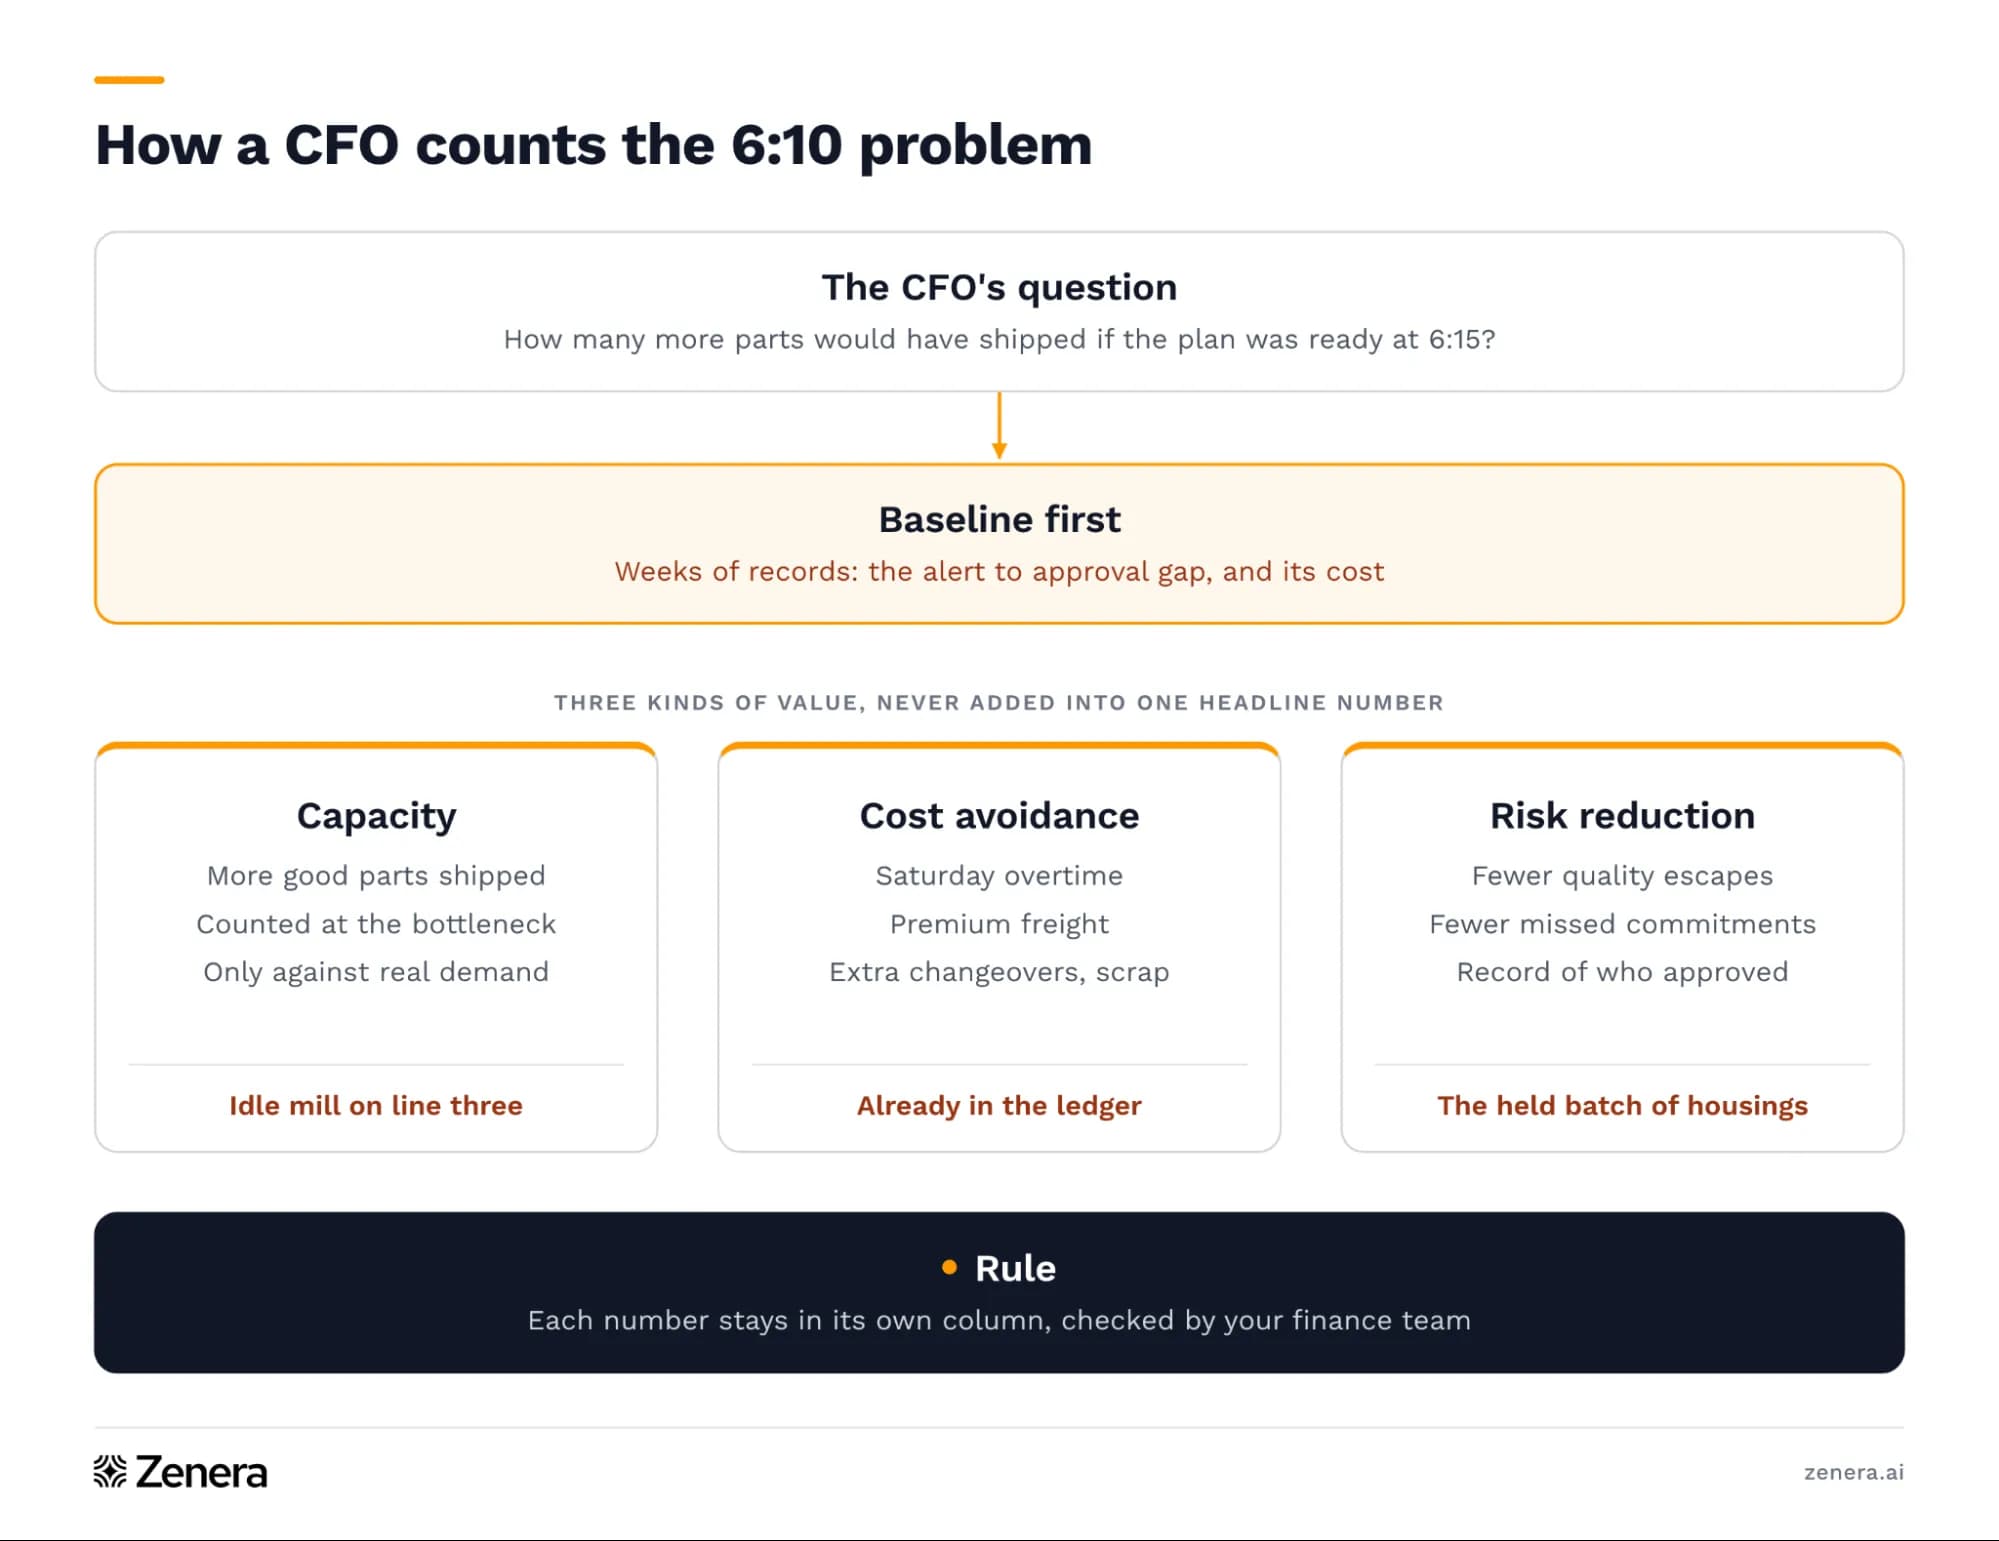
It is the following Thursday, and the plant manager from last week's 6:10 morning is sitting across from the CFO with a slide that says the plant could save four thousand planner hours a year. The CFO reads it, sets it down, and asks the only question that matters to him, which is how many more parts the plant would have shipped last Tuesday if the plan had been ready at 6:15 instead of ten o'clock. Nobody in the room has an answer, and the meeting goes quiet in the way meetings do when everyone realizes they brought the wrong number.
He is not being difficult. Hours saved are not money unless somebody can say what those hours turn into, and a planner who finishes the schedule earlier is still on the payroll at the end of the month. What finance needs is a way of counting the 6:10 problem that would hold up if an auditor walked through it, and that means separating the value into three kinds that should never be added together into one big headline figure.

The first kind is capacity, which in plain terms means more good parts out of the dock door. On Tuesday, the horizontal mill on line three was the bottleneck, the one machine that sets the pace for everything downstream, and it sat idle for most of the morning while people talked about it. If those hours had been used, the plant could have run more good parts through that machine, and each of those parts earns its contribution margin, which is the selling price minus the material and variable cost that go out the door with it. That only counts as real money if a customer was actually waiting for those parts, so the honest version multiplies by how much of the extra output the order book would have absorbed, and then subtracts what the software, the integration work, the computing, and the training cost to get there. It also means measuring at the bottleneck itself, because a pile of half-finished housings stacked in front of the next operation looks like progress but is not revenue.
The second kind is cost avoidance, which is the money the plant spent last Tuesday only because the decision came late. That includes the Saturday overtime, the premium freight to make the promised date anyway, the extra changeover from shuffling jobs around twice, and any scrap or rework from rushing. These are usually the easiest numbers to find, because they already sit in the general ledger with a purchase order or a timesheet attached to them, and the work is simply tying each one back to the disruption that caused it.
The third kind is risk reduction, which is harder to put a price on but is often what keeps a CEO up at night. On Tuesday, someone was tempted to release the held batch of housings to make the date, and if they had and the dimension was really out, the cost would have been a quality escape, a returned shipment, and a customer who stops trusting your ship dates. Risk reduction also covers how much of the plant's judgment lives in two or three people's heads, and whether there is a written record of who approved which change and why. You report this kind of value as fewer missed commitments and fewer escapes, not as a dollar figure you stretched to make the total look bigger.
You will see industry figures quoted in this space, such as ASQ's estimate that quality-related costs run fifteen to twenty percent of sales, and they are useful for knowing the size of the problem in general. We treat every public number like that, including results from other plants, as directional context and never as the business case, because your CFO will reasonably want to know your plant's figure, and the only number that matters is the one your own finance team has checked against its own books. That is why the right first step is a baseline, meaning a few weeks of honest records of how long the gap between alert and approval actually runs on the workflow you care about, and what each instance costs in throughput at the bottleneck, in avoidable spend and in near misses.
So the CFO's question from Thursday now has a shape that he can work with. The plant manager can go back and say how many bottleneck hours were lost last Tuesday, what those hours were worth at contribution margin against real demand, what the overtime and freight cost, and what risk the plant nearly took, with each number kept in its own column.
When she does that, the CFO will most likely nod and then state the next obvious thing, which is why the plant cannot simply get its existing ERP, maintenance, and quality systems to do this, since IT has already told him that connecting them would take eighteen months and a consultant army. The next episode answers that question by showing how agents that can read drawings and write their own connections get into the systems you already run in weeks, without anyone ripping anything out.
Book a demo. Ramu Sunkara, our CEO, and Dr. Sudesh Kannan offer a complimentary evaluation of one workflow, in which we help your team set the baseline for the gap and agree with finance on the single metric that would prove it closed.
If you would rather follow along first, join the mailing list and we will send each of the next six episodes as it is published.
For more information and to download the white paper, The Zenera AI Playbook White Paper, go to zenera.ai/use-cases/manufacturing/ai-playbook.